
 |
 |
 |
 |
 |
Artigo
| Detection of melamine in packaging materials using terahertz time-domain spectroscopy |
|
Shuo ZhangI,# I. College of Materials Science and Engineering, Qingdao University of Science and Technology, 266042 Qingdao, China Received: 05/03/2025 *e-mail: linasui@qust.edu.cn; liyanyu@qust.edu.cn To detect melamine in packaging materials, terahertz time-domain spectroscopy (THz-TDS) was employed to measure the terahertz absorption spectra of melamine-polyethylene mixtures with varying mass ratios (1:0-3). The results revealed distinct characteristic absorption peaks of melamine at 2.0, 2.28, and 2.6 THz. Among these, the peak at 2.0 THz was the most prominent and remained clearly observable even within packaging materials. Several common packaging materials, including low-density polyethylene (LDPE), high-density polyethylene (HDPE), polypropylene (PP), polyvinyl chloride (PVC), polystyrene (PS), polyethylene terephthalate (PET), and paperboard, were examined individually to assess their spectral interference. Characteristic melamine absorption peaks at 2.0 and 2.28 THz were used to establish a calibration model based on Gaussian distribution functions. Based on the International Union of Pure and Applied Chemistry (IUPAC) method, the limit of detection (LOD) and limit of quantification (LOQ) were calculated to be 15 and 80%, respectively. Even at a concentration close to the LOD (10%), the signal remained distinguishable (signal/noise (S/N) > 3). X-ray powder diffraction (XRD) was utilized as a complementary technique to confirm the presence of melamine in the transparent plastic zip bag. These results support the effectiveness of THz-TDS in detecting melamine through packaging materials and highlight its potential application for detecting specific molecules in packaging materials. INTRODUCTION With rapid advancements in spectroscopic detection technologies, terahertz time-domain spectroscopy (THz-TDS) has emerged as a powerful tool in various fields, particularly in chemical detection and food safety applications.1,2 Terahertz waves, occupying the 0.1-10 THz frequency range (wavelength: 0.03-3 mm), lie between microwaves and far-infrared radiation.3 The absorption characteristics in the terahertz region are predominantly governed by intermolecular vibrations, which are closely related to the motion of specific atoms and molecules. This enables the acquisition of molecular structural information through characteristic absorption peaks, facilitating non-destructive chemical identification.4THz-TDS enables multidimensional characterization of minerals by resolving lattice phonon and hydrogen-bond vibrations.5 It provides insights into crystal structures, hydration dynamics, and phase transitions. THz-TDS advances mineral analysis, offering theoretical and practical support for resource development and industrial applications.6 Melamine (C3H6N6), a nitrogen-rich compound (40% nitrogen content), has been illicitly added to food products such as milk powder to artificially increase "protein" levels.7 However, melamine poses severe health risks, including kidney damage, acute poisoning, and even death, underscoring the critical need for its detection in food safety.8 Terahertz absorption features of melamine differ significantly from those of common molecules, making THz-TDS an effective detection method. Compared to traditional techniques, THz-TDS offers advantages such as simplicity, rapidity, and non-destructive analysis, eliminating the complexities and time costs associated with sample preparation.9 THz-TDS offers faster detection times (typically within 5-10 min) and lower per-test costs due to reduced sample preparation and elimination of consumables, compared with chromatography and traditional infrared spectroscopy. THz-TDS enables direct qualitative analysis of melamine in packaging materials, supporting rapid screening and on-site detection.10 Additionally, integrating THz-TDS with complementary methods like X-ray powder diffraction (XRD), infrared spectroscopy, and Raman spectroscopy enhances detection accuracy and reliability. XRD provides crystallographic information for structural characterization,11 while multimodal approaches combining THz-TDS and XRD enable cross-validation across different structural hierarchies, further improving detection robustness.12
EXPERIMENTAL Sample preparation Melamine and high-density polyethylene (HDPE) powders (Shanghai Aladdin Biochemical Technology Co., Ltd.) were mixed at mass ratios of 1:0.5, 1:1, 1:2, and 1:3. The mixtures were ground in an agate mortar, pressed into 13.00 mm diameter pellets (thickness: 1.5 mm) under 6 tonnes-force, and encapsulated in transparent plastic zip bags for testing. Regarding pellet preparation, thickness and uniformity were controlled by using precision mold with fixed inner diameter and calibrated pressure during pressing. The pellets were measured with micrometers to ensure uniformity.Temperature variations can cause shifts in absorption features, while humidity leads to increased absorption noise due to water vapor. Our experiments were performed at room temperature (25 ºC) with dehumidification systems ensuring relative humidity (RH) = ca. 50-60%. Data processing THz signals transmitted through samples were compared to reference signals (without samples). Fast Fourier transform (FFT) converted time-domain signals to frequency-domain spectra. Refractive index n(ω) and absorption coefficient α(ω) were calculated using the Equations 1 and 2: 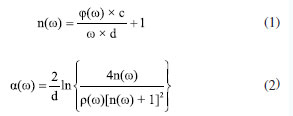 where ω, d, c, ρ(ω), and j(ω) denote angular frequency, sample thickness, vacuum light speed, amplitude ratio, and phase delay, respectively.13
RESULTS AND DISCUSSION To verify whether polyethylene powder causes interference in the THz testing of melamine, we conducted THz spectral tests on polyethylene and air, respectively. As shown in Figure 1a, polyethylene powder and air exhibit no significant absorption peaks in the THz testing band. Polyethylene merely serves as a carrier in the mixture, acting as a binder, and its impact on the THz testing of melamine can be considered negligible. This ensures the feasibility and accuracy of subsequent tests on mixed powders.
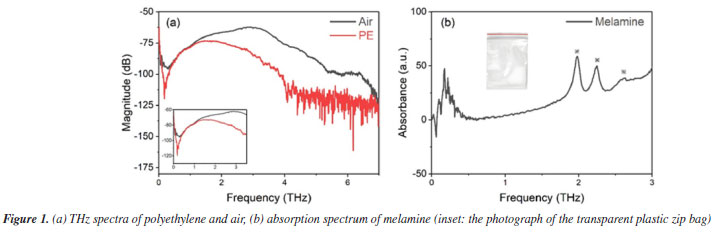
The THz spectrum of melamine powder tested under air conditions is shown in Figure 1b. It was found that the 0-3 THz region corresponds to the characteristic absorption range of melamine.14 Based on our research and further analysis, the absorption peaks of melamine can be identified at 2.0, 2.28, and 2.6 THz, which are consistent with those reported in the literature.15 Since terahertz radiation is highly sensitive to the vibrational states of sample molecules, these absorption peaks are strongly correlated with the molecular vibrations of melamine.15 Therefore, the characteristic absorption peaks can be attributed to melamine, with the most prominent peak observed near 2.0 THz, providing a standard characteristic signal for subsequent detection. We prepared mixtures of melamine and polyethylene with varying mass ratios (1:0.5, 1:1, 1:2, 1:3) and compressed the mixed powders under 6 tonnes-force to form circular pellets approximately 1.5 mm in thickness and 13.00 mm in diameter. These pellets were then subjected to THz testing in both air and transparent plastic zip bags. The transparent plastic zip bags of low-density polyethylene (LDPE) were used in the experiments, and the single side thickness is ca. 0.1 mm with the supplier of Shanghai Aladdin Biochemical Technology Co., Ltd. Additionally, we have included a photograph of the clear zip bag material in the Figure 1b to enhance clarity. Figure 2 shows the terahertz absorption spectra of the four samples with different mass ratios. A sharp peak near 2 THz is clearly observed in all samples, which, based on previous studies, is confirmed to be the characteristic absorption peak of melamine.
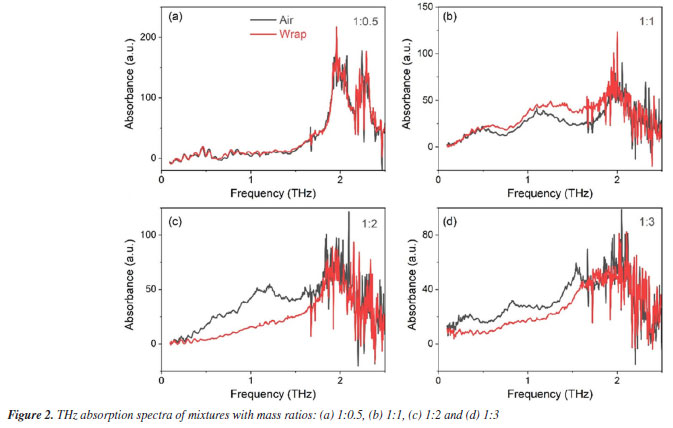
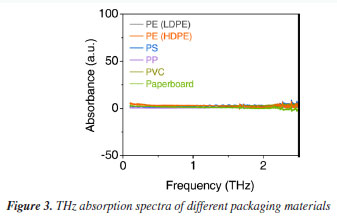
By comparing the absorption spectra of the samples in transparent plastic zip bags, it is evident that the transparent plastic zip bag does not significantly affect the position of the characteristic absorption peak of melamine. The intensity of the peak is solely dependent on the mass concentration of melamine in the samples. This indicates that terahertz waves exhibit high transparency through the transparent plastic zip bag and are not substantially interfered with by its absorption properties. The absorption peak at 2 THz remains consistent whether the samples are tested in air or within transparent plastic zip bags, demonstrating that terahertz time-domain spectroscopy can successfully penetrate transparent plastic zip bags and accurately identify the characteristic signals of melamine. To further evaluate the influence of packaging materials on the terahertz spectral detection of melamine, we conducted individual THz transmission measurements on several commonly used packaging materials, including polyethylene of LDPE (low-density polyethylene) and HDPE (high-density polyethylene, polypropylene (PP), polyvinyl chloride (PVC), polystyrene (PS), polyethylene terephthalate (PET), and paperboard. As shown in Figure 3, these materials exhibited no significant absorption peaks within the 0.1-3.0 THz frequency range and demonstrated good overall transmittance. This indicates that the attenuation of terahertz waves by such packaging materials is minimal. Therefore, the type of common packaging materials has a negligible effect on the detection results under reasonable conditions. These findings provide important support for the feasibility of non-contact, non-destructive detection of adulterants in packaged products, and further demonstrate the practicality and reliability of THz-TDS technology in the field of non-destructive detection.
Absorption spectroscopy data reveal that melamine exhibits characteristic absorption peaks at 2.0 THz and 2.28 THz. Based on these two distinct peaks, spectral data from melamine samples at varying concentrations were collected to establish a comprehensive database. Gaussian distribution model was developed to describe the relationship between the extracted characteristic absorption peaks of melamine and their corresponding concentrations. The Gaussian distribution function is expressed as follows: 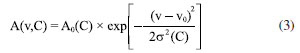 where: A(v,C) denotes the absorption intensity at frequency v, A0(C) represents the peak absorption intensity C, which depends on concentration, and follows a linear relationship: A0(C) = k × C + b; v0 is the central frequency of the absorption peak, σ(C) is the standard deviation of the absorption peak, also dependent on concentration C, expressed as: σ(C) = σ0 + δ × C, where is the initial standard deviation and, δ is the concentration-dependent variation coefficient. By summing the contributions of both absorption peaks, the total absorption spectrum can be formulated as:  The combined spectral model is thus given by:  where: A1(C) and A2(C) are the intensities of the first and second characteristic absorption peaks, respectively, v1 and v2 represent the central frequencies of the two absorption peaks (2.0 and 2.28 THz, respectively), σ1(C) and σ2(C) denote the standard deviations of the first and second absorption peaks, each following the concentration-dependent relationship defined above (Figure 4a). Potential sources of error include sample thickness variation, baseline drift in THz signals, and humidity-induced fluctuations. We employed baseline correction algorithms and repeated each measurement at least three times to calculate averaged spectra. Baseline correction was performed using low-order polynomial fitting to remove baseline drift caused by system artifacts, ensuring accurate extraction of absorption features. Additionally, Savitzky-Golay filtering was applied to suppress high-frequency noise while preserving spectral details. These methods, combined with reference calibration and FFT-based phase correction, ensured the reliability of the THz spectral analysis. Additionally, controlled indoor humidity was maintained below 50%.
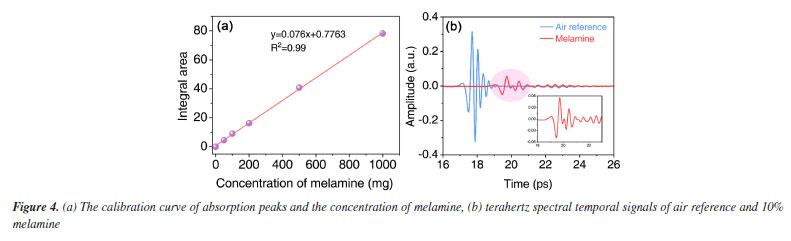
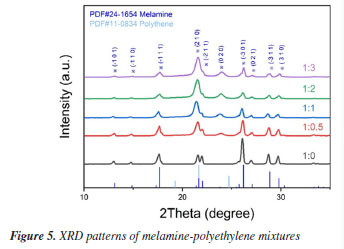
Temperature variations can cause shifts in absorption features, while humidity leads to increased absorption noise due to water vapor. Our experiments were performed at room temperature (20-25 ºC) with dehumidification systems ensuring relative humidity (RH) < 60%. The limit of detection (LOD) and limit of quantification (LOQ) were calculated using the International Union of Pure and Applied Chemistry (IUPAC)-recommended formulae (3σ/S and 10σ/S, respectively, where σ is the standard deviation of blank measurements and S is the slope of the calibration curve). The LOD and LOQ were determined to be 15 and 80% (the ratio of melamine in pelletized samples), respectively. It was performed a detailed signal/noise (S/N) analysis for mixtures with melamine concentrations below 10% in pelletized sample (Figure 4b shown the terahertz spectral temporal signals of air reference and 10% melamine). The results confirm that even at 10% melamine (close to the LOD), the signal remains distinguishable (S/N > 3). X-ray powder diffraction (XRD) testing was conducted to effectively confirm the structural states of the samples with different mass ratios and to verify the presence of melamine. As shown in the XRD patterns in Figure 5, distinct characteristic peaks are observed at multiple diffraction angles for each sample. Strong diffraction peaks are noted at 2θ angles of 17.7º, 21.6º, 26.2º, 28.8º, and 29.9º, corresponding to the (-111), (210), (-301), (-311), and (310) crystal planes of the monoclinic structure of melamine (Joint Committee on Powder Diffraction Standards (JCPDS) No. 24-1654). All four samples exhibit the same characteristic peak positions, with the peak intensities decreasing as the concentration of melamine decreases. However, the peak intensity at 21.6º gradually increases. According to the standard PDF card for polyethylene (JCPDS No. 11-0834), a characteristic peak is also observed at this angle. As the concentration of polyethylene increases and the peak intensity of melamine decreases, the relative intensity of the diffraction peak at 21.6º becomes more pronounced. Therefore, the XRD spectra further confirm the presence of sufficient melamine in each sample, ensuring the conditions for detecting characteristic signals. This complements the crystallographic information of melamine and corroborates the accuracy of the terahertz time-domain spectroscopy measurements.
CONCLUSIONS In summary, we utilized terahertz time-domain spectroscopy (THz-TDS) to identify distinct absorption peaks of melamine at 2.0, 2.28, and 2.6 THz. Additionally, we successfully measured the terahertz absorption spectra of samples within packaging materials, effectively recognizing the characteristic absorption peak of melamine at 2.0 THz. The tested packaging materials exhibited minimal interference with THz transmission, indicating that sample encapsulation does not significantly affect the spectral features of melamine. The characteristic absorption peaks at 2.0 and 2.28 THz were clearly observed and successfully used to construct a Gaussian-based spectral model to quantify melamine concentration. The method demonstrates good linearity and sensitivity, with a calculated LOD of 15% and a LOQ of 80%. Moreover, temporal signal analysis confirmed that melamine remains detectable even at concentrations near the detection threshold, supporting the practical applicability of the method. Building on this, XRD was employed to successfully detect melamine in the packaging materials, further validating the fingerprinting capability and high-transparency of terahertz spectroscopy. In the future, leveraging the advantages of terahertz spectroscopy, such as its high penetration, non-destructive nature, rapidity, and accuracy, this technology holds great potential for applications in detecting harmful residues in food, identifying illicit substances in packaging materials, and recognizing biological molecules, among other fields. THz-TDS faces material variability and humidity interference issues. Future portable terahertz time-domain spectroscopy systems with integrated electromagnetic shielding and precision humidity control systems will require AI-calibrated spectral libraries, adaptive humidity control, and hybrid sensing to achieve reliable and universal food packaging inspection across diverse products and environments.
ACKNOWLEDGMENTS This work was supported by the National Natural Science Foundation of China (22378221, 22478212), the Qingdao Science and Technology Benefit the People Demonstration and Guidance Special Project, and the Qingdao Natural Science Foundation (23-2-1-241-zyyd-jch, 24-4-4-zrjj-15-jch). The authors are grateful for the support provided by the external services of Qingdao Quenda Terahertz Technology Co., Ltd.
DATA AVAILABILITY STATEMENT The research data supporting the conclusions of this article will be made available by the corresponding authors upon request.
REFERENCES 1. Huber, R.; Tauser, F.; Brodschelm, A.; Bichler, M.; Abstreiter, G.; Leitenstorfer, A.; Nature 2001, 414, 286. [Crossref] 2. Baek, S. H.; Lim, H. B.; Chun, H. S.; J. Agric. Food Chem. 2014, 62, 5403. [Crossref] 3. Rosner, B.; Peck, J.; Van, W. D.; IEEE Trans. Antennas Propag. 2002, 50, 670. [Crossref] 4. Hwang, Y. H.; Noh, Y. H.; Seo, D.; Yeo, H. M.; Kwak, K.; Bull. Korean Chem. Soc. 2015, 36, 891. [Crossref] 5. Huang, H.; Liu, Z.; Ruggiero, M. T.; Zheng, Z.; Qiu, K.; Li, S.; Zhang Z.; Zhang Z. L.; Cryst. Growth Des. 2025, 25, 3578. [Crossref] 6. Kang, W.; Zheng, Z.; Huang, H.; Cryst. Res. Technol. 2025, 60, 2400264. [Crossref] 7. Kawase, K.; Ogawa, Y.; Watanabe, Y.; Inoue, H.; Opt. Express 2003, 11, 2549. [Crossref] 8. Liu, J.; Fan, W.; Xue, B.; Chin. Opt. Lett. 2011, 9, S10202. [Crossref] 9. Yuan, X. H.; Luo, K.; Wu, Y. J.; He, J. L.; Zhao, Z. S.; Yu, D. L.; Nanomaterials 2018, 8, 172. [Crossref] 10. Kalyan, S. A.; Elangovan, S.; Karthick, R.; Kanagathara, N.; Marchewka, M. K.; Janczak, J.; J. Mater. Sci.: Mater. Electron. 2024, 35, 2100. [Crossref] 11. Murate, K.; Mine, S.; Kawase, K.; IEEE J. Sel. Top. Quantum Electron. 2023, 29, 8500813. [Crossref] 12. Zeitler J. A. In Analytical Techniques in the Pharmaceutical Ciences; Müllertz, A.; Perrie, Y.; Rades, T., eds.; Springer: New York, 2016, p. 171. [Crossref] 13. Dorney, T. D.; Baraniuk, R. G.; Mittleman, D. M.; J. Opt. Soc. Am. A 2001, 18, 1562. [Crossref] 14. Sun, X.; Zhu, K.; Hu, J.; Jiang, X.; Liu, Y.; J. Appl. Spectrosc. 2019, 86, 661. [Crossref] 15. Naftaly, M.; Miles, R. E.; Proc. IEEE 2007, 95, 1658. [Crossref]
Associate Editor handled this article: Boniek G. Vaz |

On-line version ISSN 1678-7064 Printed version ISSN 0100-4042
Qu�mica Nova
Publica��es da Sociedade Brasileira de Qu�mica
Caixa Postal: 26037
05513-970 S�o Paulo - SP
Tel/Fax: +55.11.3032.2299/+55.11.3814.3602
Free access