
 |
 |
 |
 |
 |
Artigo
| In situ fe doped anodized tio2 nanotubes: characterization and photocurrent response |
|
Gustavo R. S. PaulaI; Andréia R. C. CarneiroII; Leandro A. SantosIII; Dalila C. SicupiraII; Rosa M. R. JunqueiraI* I Departamento de Engenharia Química, Universidade Federal de Minas Gerais, 31270-901 Belo Horizonte - MG, Brasil Received: 03/24/2025; *e-mail: rosajunqueira@gmail.com Guest Editor handled this article: Paula M. Jardim TiO2 nanotubes have attracted interest since they can be used as photocatalysts in degrading organic pollutants and hydrogen production from water electrolysis. However, there are limitations in the photocatalytic applications of TiO2, since this semiconductor presents a relatively wide band gap (3.0-3.2 eV) and a high recombination rate of electron-hole pairs. Doping TiO2 nanotubes with Fe3+ is suggested to overcome these limitations. The present work aims to produce iron-doped nanotubes (Fe-TiO2) through electrochemical anodization with in situ doping, characterize these nanostructures by scanning electron microscopy, Fourier transform infrared spectroscopy, energy dispersive spectroscopy (EDS), X-ray diffraction, and UV-Vis (ultraviolet-visible) diffuse reflectance spectroscopy, and evaluate the effect of doping on the photoactivity of TiO2. The synthesis was carried out under a potential of 48 V for 2 h. EDS confirmed the presence of iron in the Fe-TiO2 sample. Microscopy showed that doping caused a reduction in the internal diameter of the nanotubes and the thickness of the anodic film. The average band gaps obtained were 2.962 ± 0.107 eV for Fe-TiO2 and 3.057 ± 0.049 eV for pure TiO2. In the photoelectrochemical tests, the doped samples showed a slightly enhanced photoresponse compared the undoped ones, indicating that doping affects the photocatalytic properties of TiO2. INTRODUCTION TiO2 nanostructures doped with metal ligands stand out as one of the most promising materials for application in photocatalytic processes. Heterogeneous photocatalysis is a specific kind of chemical reaction that occurs on the surface of solid materials with semiconductor properties and can be used both for the degradation of organic contaminants in the so-called advanced oxidative processes (AOPs) and the production of hydrogen through the photoelectrochemical splitting (PEC) of water.1,2 Nanostructured titanium dioxide can present different morphologies such as nanoparticles, nanotubes, and nanofibers.3 In most cases, TiO2 is used as a photocatalyst in the form of nanotubes (TiO2-NTs) due to its large surface area, high efficiency, rapid synthesis, and good cost-benefit. In addition, it can be obtained with a highly ordered geometry with a one-dimensional direction. This last property is relevant because it favors the unidirectional transport of electrons.4,5 Thus, the morphology of TiO2-NTs plays an essential role in optimizing their photoelectrochemical properties. TiO2 nanotubes can be obtained by various processes such as electrospinning, hydrothermal methods, and electrochemical anodization.3 Electrochemical anodization, also known as electrochemical oxidation, is an easy, efficient, and cost-effective way to obtain nanostructures in metals and metal alloys.6,7 When compared to other methods, anodization stands out because, in most of them, the nanotubes are obtained in powder form, requiring an additional step for their immobilization on a substrate. In electrochemical anodization, the nanotubes are arranged vertically in a continuous layer that is connected to the substrate.3 Furthermore, anodization is a fast process, in which it is easy to control the length and structure of the nanotubes.8 Some anodization parameters such as applied potential, anodization time, temperature, and electrolyte composition directly affect the morphological attributes (pore diameter, wall thickness, and anodic film thickness) of TiO2 nanotubes.9 Among these, the composition of the electrolyte is often pointed out as the factor that most impacts morphology.10 Despite being widely used by photocatalysts, TiO2-NTs have certain limitations. For semiconductor material to be used as a photocatalyst, the energy of the incident photons must be greater than the band gap energy (Eg) of the material studied. In the case of TiO2, this band gap value varies in the range of 3.0-3.2 eV.4 Consequently, pure titanium dioxide only operates effectively under ultraviolet light (< 400 nm), which accounts for 5 to 7% of total solar emissions.5,11,12 In this scenario, the aim is to extend the photoresponse of TiO2 to longer wavelengths, in the visible region, since this region represents approximately 45% of the energy radiated by the sun.5 Furthermore, another problem faced in the photocatalytic applications of TiO2-NTs is the high rate of electron-hole recombination, which ends up restricting its use.8 Doping TiO2 nanotubes with metal ligands is a possible way to reduce the band gap value and extend the photoresponse of titanium dioxide, since it acts by decreasing the recombination rate of charge carriers.13 Among the possible ligands that can be used in the doping of TiO2-NTs, iron stands out because the approximate size of the Fe3+ and Ti4+ ions facilitates the integration of this dopant into the Ti-O crystal lattices.5,12 Furthermore, iron ions have low band gap energy (approximately 1.43 eV) and can act by reducing electron-hole recombination, causing an improvement in photoactivity.14 Thus, in this work, we report the influence of doping anodic titanium nanotubes on their morphology and on the chemical and structural characteristics. The effect of doping the titanium nanotubes on the photoactivity was also investigated.
EXPERIMENTAL All reagents used for anodization and doping are of analytical purity, and no additional purification steps were performed. Ammonium fluoride (NH4F, 98%, Dinâmica), ethylene glycol (C2H6O2, 99.5%, Dinâmica), iron nitrate (Fe(NO3)3.9H2O, 98%, Êxodo Científica), titanium foils (99.7%, 0.25 mm thick, Aldrich Chemistry), and ethyl alcohol (99.5%, Neon) were used. Synthesis and doping of nanotubes Small strips of titanium foil were cut and cleaned in ultrasound: 10 min in deionized water and 10 min in ethyl alcohol. The nanotubes were synthesized from electrochemical anodization with a constant supply voltage (Keithley 2260B). Titanium foils were used as an anode and a titanium plate as a cathode, with 2 cm between them. The electrolyte used was a solution of NH4F 1 wt.% and H2O 5 wt.% in ethylene glycol and the anodization was performed at a potential of 48 V for a time of 120 min.5 The doping of the nanotubes was performed in situ by adding 9.9 mM Fe(NO3)3.9H2O (0.05 at.%) to the working electrolyte. The current was monitored throughout the process using a digital ammeter (Tektronix DMM4020). At the end of the anodization, the samples were washed with distilled water and ethyl alcohol and dried in air. All anodized samples were heat treated in a muffle furnace at a temperature of 550 °C for 120 min. Sample characterization The top surface of the anodized samples was observed by high-resolution scanning electron microscopy (FE-SEM, FEI Quanta 3D) for morphological characterization. An acceleration potential of 5 kV and secondary electron imaging were used in the image acquisition. Nanotube dimensions (diameter, length, and wall thickness) were measured using the free ImageJ 1.53K software (National Institute of Health, USA).15 For this purpose, approximately 10 images of each of the conditions evaluated (doped and undoped) were acquired, and the averages of the measured morphological parameters were taken. Student's t-tests with a significance level of 99% (α = 0.01) were performed to compare the average dimensions of the doped and undoped nanotubes. The phase composition was determined by X-ray diffraction (XRD) on an X-ray diffractometer (Panalytical Empyrean with Cu source kα λ = 0.15418 nm). XRD analyses were performed in the range 5° ≤ 2θ ≤ 80°.16 The chemical composition and the percentage of Fe3+ deposited on the anodic films were determined by energy dispersive spectroscopy (EDS). The functional groups present in each sample were identified by Fourier transform infrared spectroscopy (FTIR) in the range of 400-4000 cm-1. The reflectance profile of the samples was determined by UV‑Vis diffuse reflectance spectrophotometry (Shimadzu UV 2600 with 0.5 nm resolution). The scanning range was from 190 to 1100 nm, using barium sulfate as the reflectance standard. Measurements were performed in triplicate for the doped and undoped samples. A t-test with a significance level of 95% (α = 0.05) was performed to compare the mean responses. Photoelectrochemical performance Photoelectrochemical measurements were performed in a standard three-electrode configuration, with each sample prepared as the working electrode, Pt as the counter electrode, and Ag/AgCl as the reference electrode, using a Metrohm Dropsens uStat-i 400s potentiostat. A 5 g L-1 Na2SO4 solution was used as the electrolyte.12 A light emitting diode (LED) lamp (100 mW cm-2, λ > 385 nm was used as the irradiation source for excitation of the photoanodes. The performance of the photoanodes was evaluated by linear voltammetry and chronoamperometry. The illuminated area of the photoanodes was 1.5 cm2. Voltammetry was conducted under illumination with a potential sweep from 0 to 1.0 V at a rate of 50 mV s-1. In the chronoamperometry test, a constant potential of 0.9 V was applied to the working electrode, and the current density was measured over time. In this test, the samples were subjected to light-dark cycles lasting 60 s each cycle.
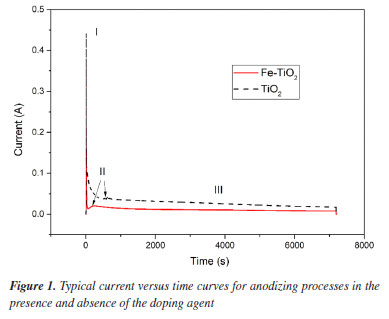
RESULTS AND DISCUSSION During all the anodization, the current versus time profile was monitored. Typical curves obtained are shown in Figure 1. The addition of the doping agent to the working electrolyte promoted a slight reduction in the current overtime. The behavior of the curves representing the growth of the anodic films agrees with that described in the preexisting literature.3,10,17,18 The prominent peaks observed in the first seconds of anodization (stage I) indicate the formation of a compact oxide film. At this point, the current reaches its maximum and drops very fast. This happens because the growth of the anodic layer difficulties the current circulating. In stage II, nanopores are formed due to the interactions of TiO2 with the F- ions, leading to the formation of [TiF6]2-. It can be noted that in this stage the current increases slightly due to the increase in surface area. In stage III, the current stabilizes due to the self-organization of the nanopores and the growth of nanotubes.
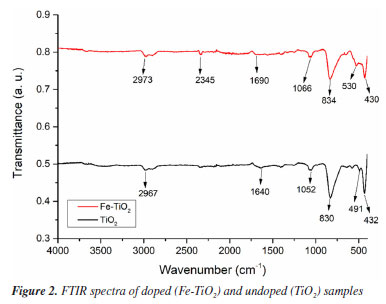
The spectra obtained in the FTIR tests for the doped and undoped samples are shown in Figure 2. The FTIR spectra showed similar profiles for the TiO2 and Fe-TiO2 samples. All samples exhibited peaks in the range between 2960-2980 cm-1, which can be attributed to the narrowing of the C-H bond, indicating the presence of electrolyte residues.19 The same explanation can be given for the peak observed in the doped sample at 2345 cm-1, which corresponds to the C=O stretching.5 The peaks obtained at 1690 cm-1 for Fe-TiO2 and 1640 cm-1 for TiO2 are due to the H-O-H bond of water adsorbed on the surface of the nanotubes.5,20 The peaks in the range of 1050-1070 cm-1 correspond to the anatase phase of TiO2.19 In the doped sample, a prominent peak was observed at 834 cm-1, this may be indicative of the presence of iron in the sample since bands present in the range of 700-930 cm-1 can be attributed to the Fe-O-Ti bond.5 However, a peak of equal magnitude was also observed in the same region for the undoped sample. Some studies19,20 in the literature state that the peaks present in broad ranges such as 550-800 cm-1 and 400-900 cm-1 correspond to the Ti-O-Ti and O-Ti-O bonds. Therefore, the results indicate that there may have been an overlap of peaks in the samples, preventing the identification of certain bonds. Thus, additional characterization is necessary to explain the differences between pure TiO2 and Fe3+-doped TiO2 nanotubes.
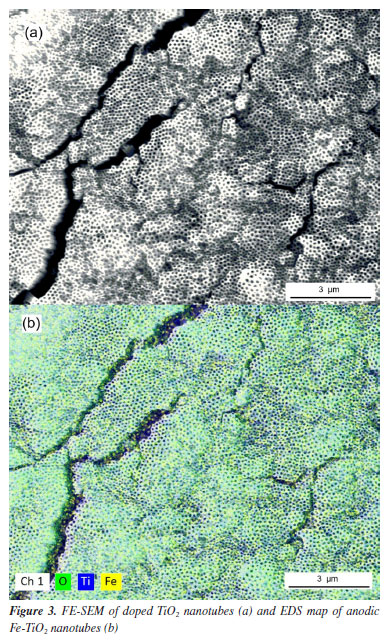
The elemental composition obtained by EDS of the undoped and doped TiO2 nanotubes are presented in Table 1. The atomic percentage of iron found for the doped sample was 1.69%. This value agrees with the report of other studies5,9,21 found in the literature, where contents such as 2.47, 1.50, and 0.38% were obtained for samples of anodic oxide nanotubes doped with iron. Even though the concentration of Fe is present in a low concentration of 1.69 at.% in the doped sample, the presence of iron could also be observed in the elemental EDS mapping, as illustrated in Figure 3b. It can also be noted that the iron is distributed throughout the entire sample surface.
The crystallinity of the samples and the phase composition can be evidenced in the X-ray diffractograms showed in Figure 4. In both samples, the peaks of the metallic phase of titanium (011) and the anatase phase (004, 020, and 220) were identified at angles of 25.30°, 37.79°, 48.36°, and 70.23°, respectively. Furthermore, in the Fe-TiO2 sample, a peak (015) was identified at 53.89°, and in the undoped sample, a peak (121) was verified at 55.06°, both peaks corresponding to the anatase phase of TiO2. Although rutile is considered the most stable phase for extended systems, at the nanoscale the anatase phase has greater stability and favors charge transport, benefiting photocatalytic processes.21
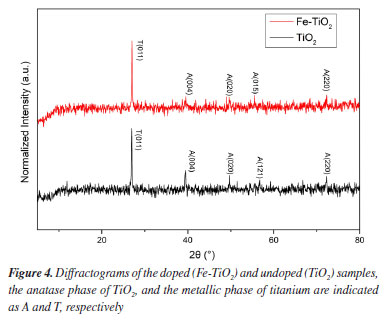
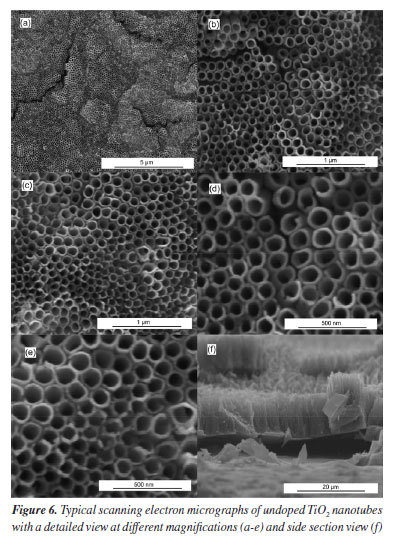
No reflections related to iron-containing phases were identified in the Fe-TiO2 sample. This can be explained in two ways: the iron concentration in the doped sample was below the detection level of the diffractometer and/or the iron ions were incorporated into the TiO2 crystal structure, making it impossible to form a secondary iron phase that could be detected.4,5 Morphological analysis indicated that there were some differences between the doped and undoped samples. Typical micrographs are presented in Figures 5 and 6. The existence of TiO2 nanotubular structures can be seen in both figures. The parameters evaluated were the thickness of the anodic film, the internal diameter of the nanotubes, and the wall thickness. Table 2 presents the relationship between the average dimensions of each parameter obtained in the samples doped with Fe3+ ions and undoped samples.
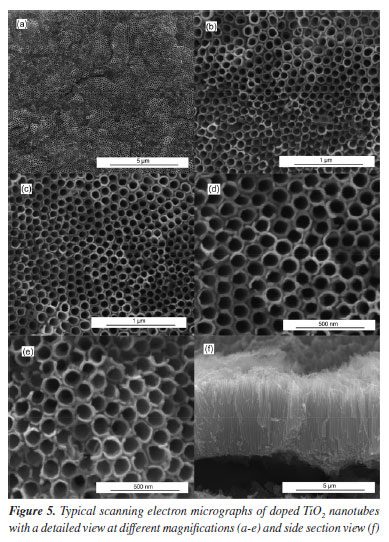
These results contrast with some previous works5,21,22 that claim that doping with Fe3+ ions does not affect the inner diameter of TiO2 nanotubes nor the thickness of the anodic film. However, it is in agreement with what was observed in another study,4 where the introduction of iron ions into the electrolyte caused a slight reduction in the dimensions of the nanotubes and the anodic film. The addition of iron to the electrolyte directly interferes with the morphology of the anodic film, causing a decrease in the diameter of the nanotubes and a reduction in the thickness of the anodic film. An increase in the iron concentration prevents the formation of nanotubular structures and promotes the degradation of the anodic film.23 A possible explanation for this phenomenon is that the Fe3+ available in the reaction medium binds to the fluoride ions, reducing their availability and slowing down the growth of the nanotubes. This is because the growth of the nanotubes occurs in three stages: field-assisted oxidation, field-assisted dissolution, and chemical dissolution. This last stage is directly linked to the concentration of F- ions. When Fe3+ is added to the working electrolyte, the iron can react with the fluoride ions:24

Thus, the growth of nanotubes is compromised by the low availability of F-. The reflectance spectra fitted by the Kubelka-Munk function are presented in Figure 7a. The fitted reflectance data were used to determine the band gap of the samples through the Tauc curves considering the indirect allowed phase transition for TiO2 (Figure 7b).
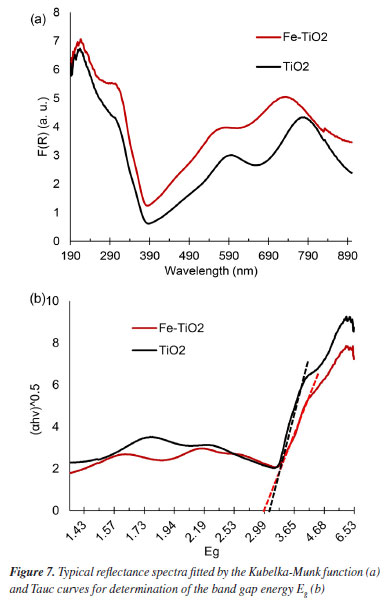
The average Eg found for the Fe-TiO2 and TiO2 samples were 2.962 ± 0.107 eV and 3.057 ± 0.049 eV, respectively. The p-value, obtained through the t-test, was 0.402 (i.e., > 0.05), therefore, it can be concluded that the averages are statistically equal. Thus, based on the Eg determinations, it cannot be stated that doping had any effect on the band gap. The Eg values obtained in both conditions are around 3.0 eV, this indicates that both samples are more photoactive in the UV region, having a maximum absorption length (λmax) of around 400 nm.25 The average Eg resembles reports from other research.4,26 There are studies in which it was verified that for anodization carried out at 40 V, the band gaps of the doped (3.05 eV) and undoped (3.0 eV) samples were practically the same.4 One explanation for this is that high anodization potentials are capable of creating oxygen vacancies that hide the effect of doping.4,8 It is known that oxygen vacancies can form both on the surface and inside the oxide film and impact the electronic structure, charge transport, and interaction with sunlight.27 Photoelectrochemical performance Linear voltammetry A linear voltammetry test was performed to evaluate the photocurrent density of Fe-TiO2 and TiO2 samples. The I-V curves (Figure 8) show the behavior of electric current during the potential sweep.
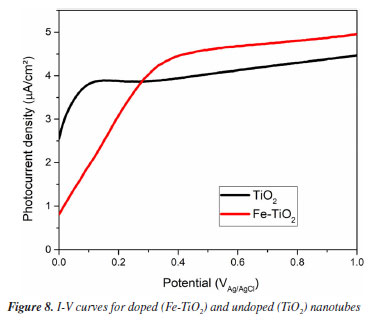
Current densities increased with increasing applied potential. This behavior is widely reported in the literature.4,23,28,29 At the beginning of the scan, the photocurrent of pure TiO2 was higher than that of Fe-TiO2, however, the increase in potential caused an increase in the photocurrent of the doped sample. For example, when the applied potential was 0.7 V, the photocurrent was approximately 4.73 µA cm-2 for Fe-TiO2 and 4.21 µA cm-2 for TiO2. These results indicate that doping promoted a slight increase in photoactivity. Chronoamperometry The chronoamperometry test was performed to evaluate the stability of the samples over time. The results obtained under visible light are presented in Figure 9. It can be seen that both TiO2 and Fe‑TiO2 were stable during the 300 s of the test. The results also show that the doped samples presented a slightly higher photocurrent than the undoped ones. This occurs because iron doping improves light absorption, favoring the separation and migration of charge carriers.4 Furthermore, the current density increased rapidly when the light was turned on and dropped abruptly when the light was turned off, indicating that the samples have a fast response to electron-hole pairs (e--h+) excitation and discharge.
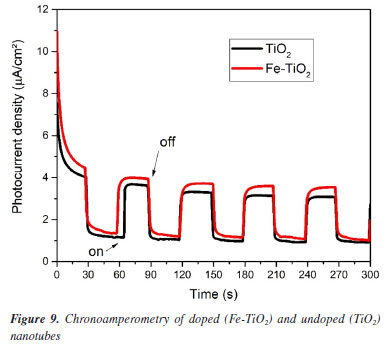
The current densities found were approximately 3.95 µA cm-2 for Fe-TiO2 and 3.60 µA cm-2 for TiO2. One of the justifications for this is that the measurements of the photoelectrochemical tests in this work were performed only in the visible light range. The influence of the wavelength used on the resulting photoresponse is observed in other works in the literature.29,30 In some studies, chronoamperometry tests performed with a filter that simulates the entire solar spectrum had a photocurrent of 54 µA cm-2, whereas when the test was performed only under visible radiation, the photocurrent was approximately 3 µA cm-2.30
CONCLUSIONS It is possible to obtain TiO2 and Fe-TiO2 nanotubes through electrochemical anodization without and with in situ doping using a potential of 48 V and an anodization time of 120 min. The addition of iron ions in the working electrolyte promotes a slight reduction in the current during the anodization process. Fourier transform infrared spectroscopy analyses were not sufficient to prove the presence of iron in the doped TiO2 nanotubes. The same can be said for X-ray diffraction. However, the presence of iron in the doped samples was observed by energy dispersive spectroscopy, which showed a content of 1.69 at.%. X-ray diffractograms indicate that TiO2 and Fe-TiO2 nanotubes have the anatase phase. At the nanoscale, this phase has greater stability and favors photocatalytic processes. Iron doping alters some morphological attributes of TiO2 nanotubes. It was observed that the internal diameter of the nanotubes and the thickness of the anodic film are smaller in the Fe-TiO2 samples, however, doping did not alter the thickness of the nanotube wall. The influence of iron doping on morphology can be attributed to the low availability of F- ions in the reaction medium. This may occur because the ionic iron present in the electrolyte binds to the fluoride-generating FeFn3-n. Doping did not cause variations in the band gaps of the samples, since the average values found are statistically equal: 2.962 ± 0.107 eV for the Fe-TiO2 and 3.057 ± 0.049 eV for the TiO2. The photoelectrochemical performance of Fe-TiO2 was slightly superior to that of TiO2. However, the results may not reflect the real photocatalytic capacity of the samples, since the band gaps were found to indicate that they are photoactive only in the UV region, and the photocatalytic measurements were performed mainly in the visible region.
DATA AVAILABILITY STATEMENT All data are available in the text.
ACKNOWLEDGMENTS The authors would like to thank the National Council for Scientific and Technological Development (CNPq), the Minas Gerais State Research Support Fund (FAPEMIG), the Coordination for the Improvement of Higher Education Personnel (CAPES), the Microscopy Center of the Federal University of Minas Gerais and the Electrochemical Testing and Corrosion Laboratory of the Chemistry Department of the Federal University of Ouro Preto.
REFERENCES 1. Akhter, P.; Arshad, A.; Saleem, A.; Hussain, M.; Catalysts 2022, 12, 1331. [Crossref] 2. Denisov, N.; Zhou, X.; Cha, G.; Schmuki, P.; Electrochim. Acta 2021, 377, 137988. [Crossref] 3. Sopha, H.; Macak, J. M. In Nanostructured Anodic Metal Oxides; Sulka, G. D., ed.; Elsevier: Amsterdam, 2020, ch. 6. [Crossref] 4. Guaglianoni, W. C.; Ruwer, T. L.; Caldeira, L. E. N.; Wermuth, T. B.; Venturini, J.; Bergmann, C. P.; Mater. Sci. Eng., B 2021, 263, 114896. [Crossref] 5. Zafar, Z.; Ali, I.; Park, S.; Kim, J.-O.; Ceram. Int. 2020, 46, 3353. [Crossref] 6. Resende, P. D.; Junqueira, R. M. R.; Silva, J. D.; Lopes, N. I. A.; Santos, L. A.; Buono, V. T. L.; J. Mater. Res. Technol. 2020, 9, 10121. [Crossref] 7. Sulka, G. D. In Nanostructured Anodic Metal Oxides; Sulka, G. D., ed.; Elsevier: Amsterdam, 2020, ch. 1. [Crossref] 8. Venturini, J.; Bonatto, F.; Guaglianoni, W. C.; Lemes, T.; Arcaro, S.; Alves, A. K.; Bergmann, C. P.; Appl. Surf. Sci. 2019, 464, 351. [Crossref] 9. Sołtys-Mróz, M.; Syrek, K.; Pierzchała, J.; Wiercigroch, E.; Malek, K.; Sulka, G. D.; Appl. Surf. Sci. 2020, 517, 146195. [Crossref] 10. David, T. M.; Dev, P. R.; Wilson, P.; Sagayaraj, P.; Mathews, T.; Electrochem. Sci. Adv. 2022, 2, e202100083. [Crossref] 11. Dong, Z.; Chen, M.; Qin, D.; Han, S.; Fuel 2024, 373, 132366. [Crossref] 12. Zhang, Y.; Gu, D.; Zhu, L.; Wang, B.; Appl. Surf. Sci. 2017, 420, 896. [Crossref] 13. Shankar, K.; Basham, J. I.; Allam, N. K.; Varghese, O. K.; Mor, G. K.; Feng, X.; Paulose, M.; Seabold, J. A.; Choi, K.-S.; Grimes, C. A.; J. Phys. Chem. C 2009, 113, 6327. [Crossref] 14. Ismael, M.; J. Environ. Chem. Eng. 2020, 8, 103676. [Crossref] 15. Schneider, C. A.; Rasband, W. S.; Eliceiri, K. W.; Nat. Methods 2012, 9, 671. [Crossref] 16. Esteves, M.; Fernández-Werner, L.; Pignanelli, F.; Romero, M.; Chialanza, M. R.; Faccio, R.; Mombrú, Á. W.; Ceram. Int. 2020, 46, 2877. [Crossref] 17. Berger, S.; Hahn, R.; Roy, P.; Schmuki, P.; Phys. Status Solidi B 2010, 247, 2424. [Crossref] 18. Roy, P.; Berger, S.; Schmuki, P.; Angew. Chem., Int. Ed. 2011, 50, 2904. [Crossref] 19. Suwondo, K. P.; Aprilita, N. H.; Wahyuni, E. T.; React. Kinet., Mech. Catal. 2022, 135, 479. [Crossref] 20. Mishra, S.; Chakinala, N.; Chakinala, A. G.; Surolia, P. K.; Catal. Commun. 2022, 171, 106518. [Crossref] 21. Wang, G.; Zhang, H.; Wang, W.; Zhang, X.; Zuo, Y.; Tang, Y.; Zhao, X.; Sep. Purif. Technol. 2021, 268, 118591. [Crossref] 22. Zhang, C.; Tian, S.; Xu, C.; Li, L.; Zhou, J.; Xue, F.; J. Mater. Sci.: Mater. Electron. 2019, 30, 20892. [Crossref] 23. Momeni, M. M.; Ghayeb, Y.; J. Electroanal. Chem. 2015, 751, 43. [Crossref] 24. Sun, L.; Li, J.; Wang, C. L.; Li, S. F.; Chen, H. B.; Lin, C. J.; Sol. Energy Mater. Sol. Cells 2009, 93, 1875. [Crossref] 25. Gopinath, K. P.; Madhav, N. V.; Krishnan, A.; Malolan, R.; Rangarajan, G.; J. Environ. Manage. 2020, 270, 110906. [Crossref] 26. Wei, X.; Wang, H.; Zhu, G.; Chen, J.; Zhu, L.; Ceram. Int. 2013, 39, 4009. [Crossref] 27. Xie, H.; Li, N.; Chen, X.; Jiang, J.; Zhao, X.; Appl. Surf. Sci. 2020, 511, 145597. [Crossref] 28. Velásquez, D. A. P.; Sousa, F. L. N.; Soares, T. A. S.; Caires, A. J.; Freitas, D. V.; Navarro, M.; Machado, G.; J. Power Sources 2021, 506, 230165. [Crossref] 29. Wang, X.; Zhao, J.; Kang, Y.; Li, L.; Xu, X.; J. Appl. Electrochem. 2014, 44, 1. [Crossref] 30. Velásquez, D. A. P.: Fabricação de um Novo Fotocatalisador Híbrido: Nanotubos de TiO2/AgIn5Se8 QDS para Produção de Hidrogênio Fotocatalítico e Fotoeletrocatalítico; Dissertação de Mestrado, Universidade Federal de Pernambuco, Recife, Brasil, 2020. [Link] acessado em setembro 2025 |

On-line version ISSN 1678-7064 Printed version ISSN 0100-4042
Qu�mica Nova
Publica��es da Sociedade Brasileira de Qu�mica
Caixa Postal: 26037
05513-970 S�o Paulo - SP
Tel/Fax: +55.11.3032.2299/+55.11.3814.3602
Free access